Frameworks speed up problem analysis
If you’re overwhelmed and you’re not getting the results you want then you need to diagnose the problem. Context, objectivity, and structure give meaning to information and makes it possible to analyse problems. When analysing time management and productivity problems it helps to have a framework that defines the full ‘scope of work’ or ‘solution space’ of all the possible issues you may be struggling with.
You need structure to be able to identify what’s missing
Imagine if you had a map of all the productivity elements in it and it was structured logically, which enabled you to find any missing pieces. This would empower you to identify your problem area and apply a just-in-time learning intervention. Imagine if you had access to a framework that had structure and logic and was easy to navigate. Well, you’re in luck, I’ve developed one for you.
Structure is elegance
One of the most significant insights I have had from studying science, chemistry, astronomy, and cosmology is that the universe has structure in every place you look. It is profoundly beautiful and elegant. Structure enables understanding and empowers logic and utility. So I wanted to borrow a framework from the world of science to help structure my understanding of productivity concepts and best practice. The matrix structure of the periodic table of chemical elements and the periodic table of quantum particles and forces in quantum physics were elegant examples.
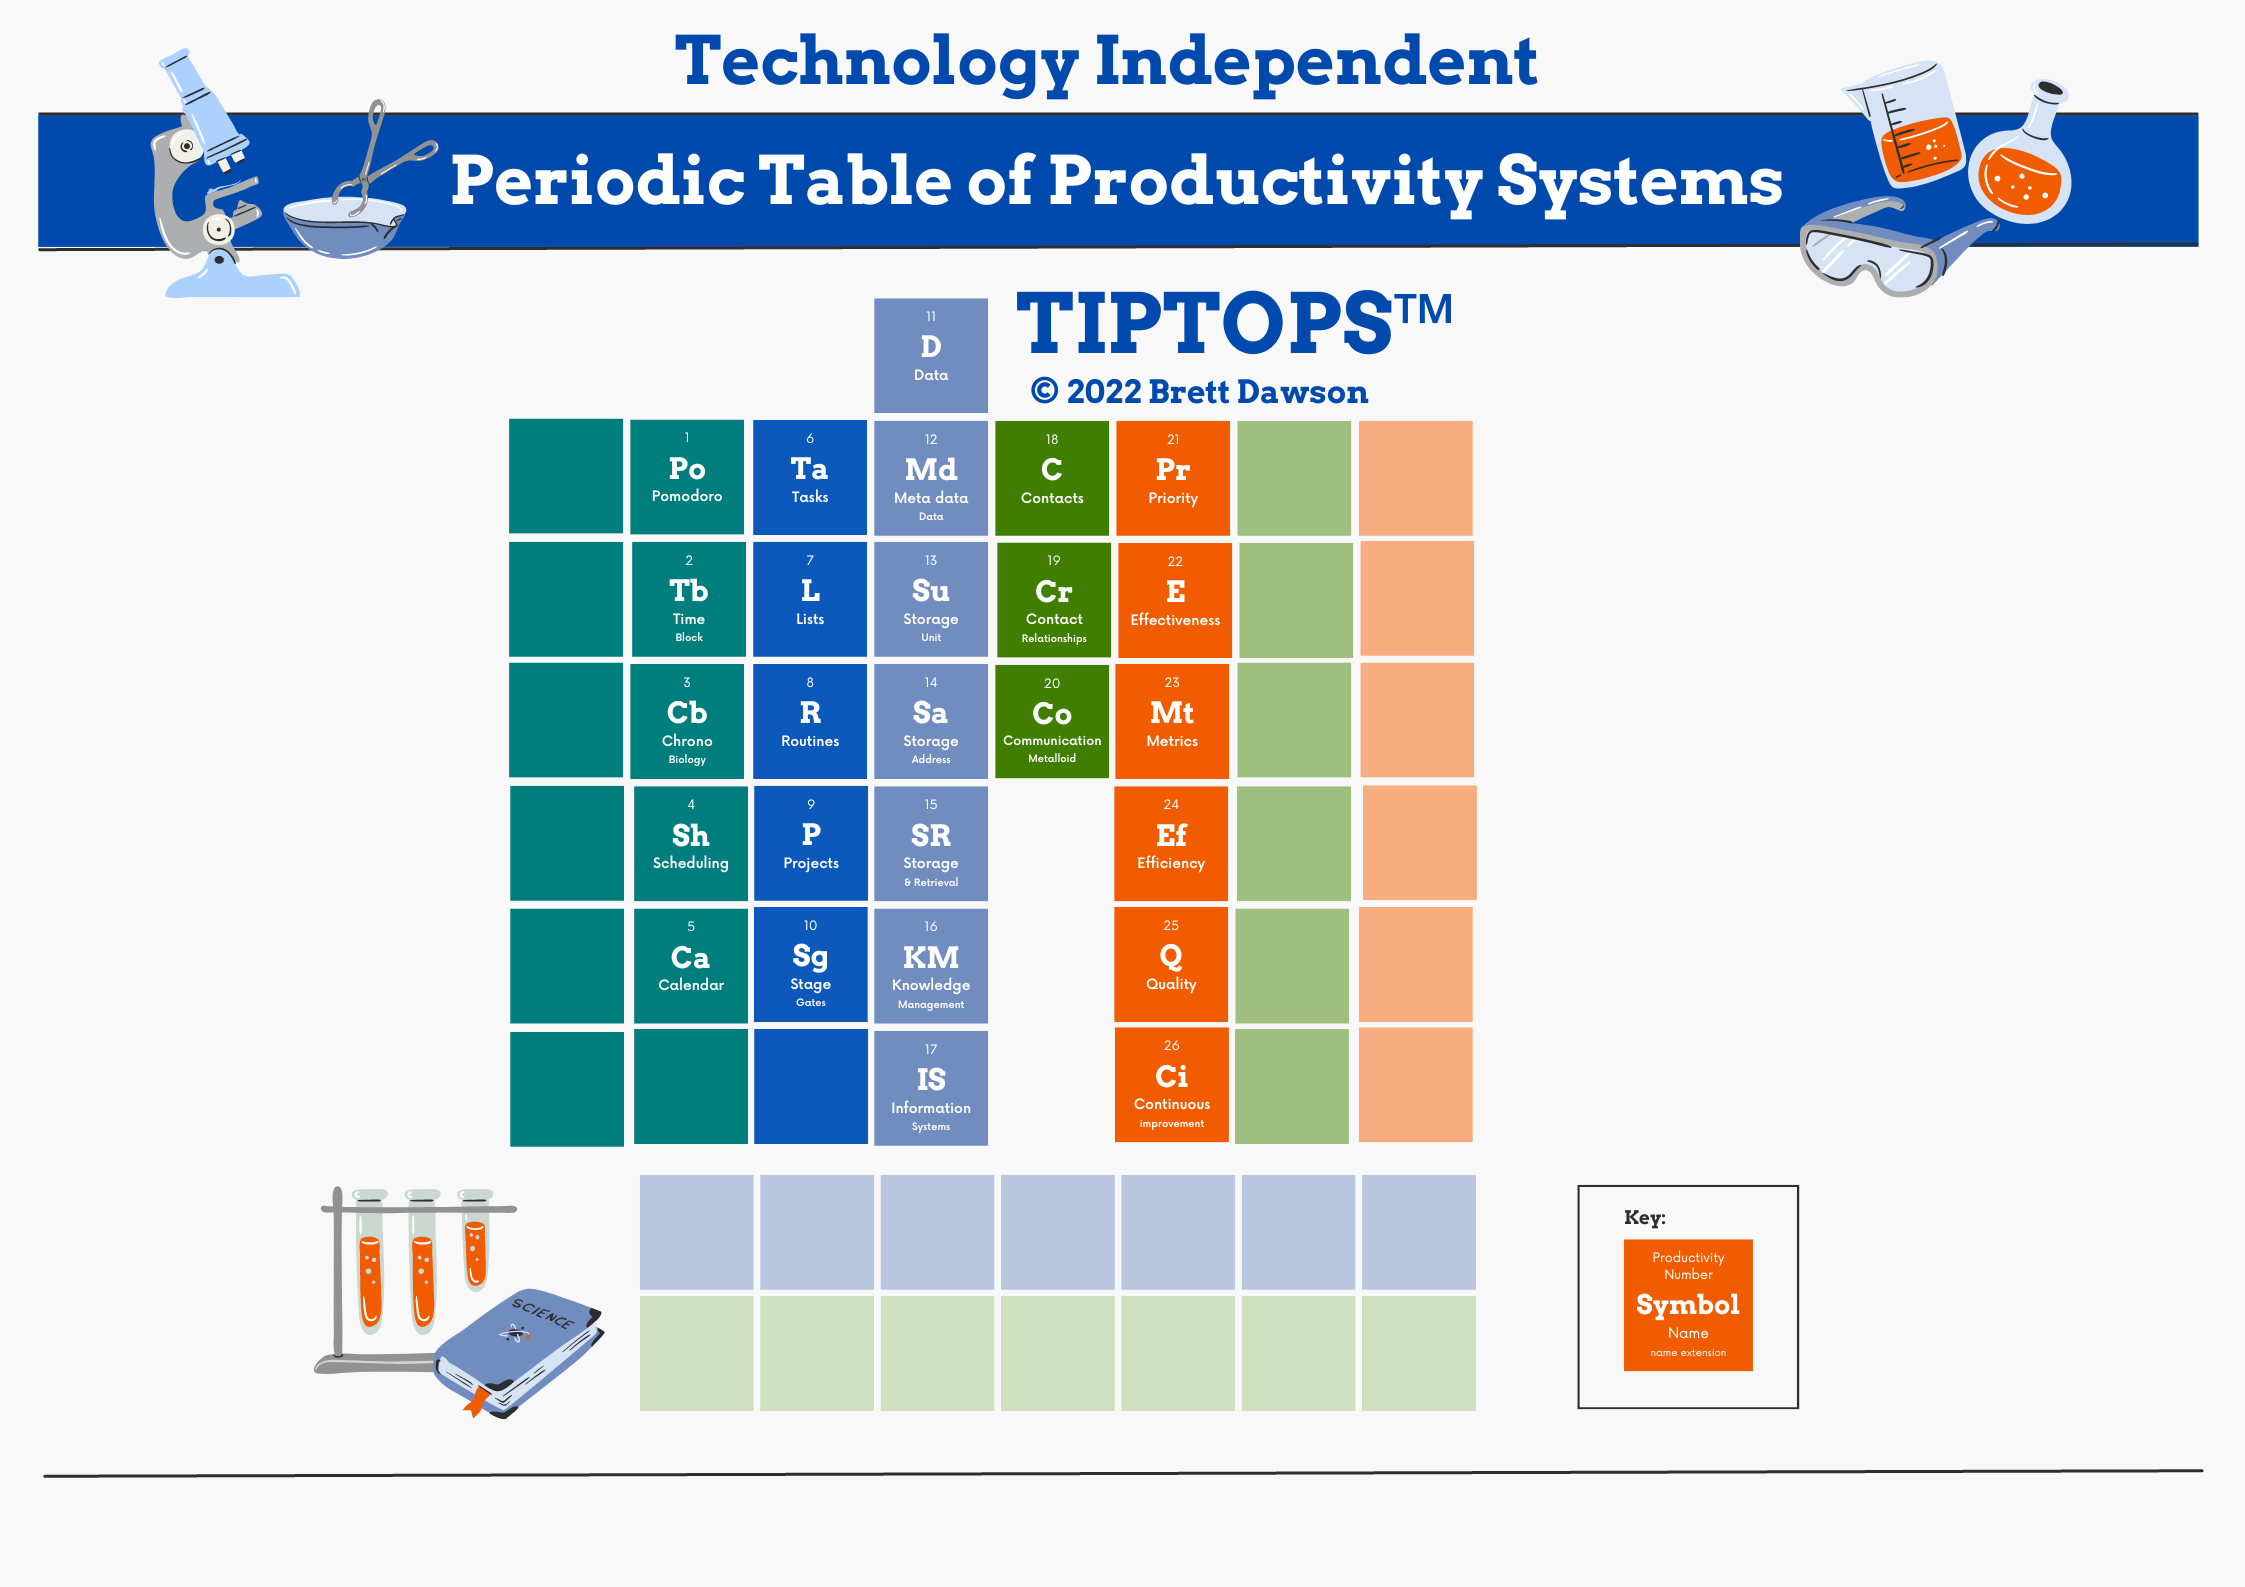
I’ve borrowed the analogy from the periodic table of elements, which is essentially a series of lists laid out in a two-by-two matrix structure. I call it the Technology Independent Period Table of Productivity Systems or TIPTOPS™. The reason I selected this framework is that it breaks complex productivity systems and processes down into discrete concepts, principles, and skills that are best understood individually before being used in conjunction with others.
This enables you to get back to basics, understand the principles and work on the core skills that may be missing from your productivity portfolio. You need to learn to walk before you can run. Using the chemistry analogy, you want to start with the test tube stuff before your build a commercial-scale reactor.
So let’s look at the structure of the TIPTOPS table
Structure of the TIPTOPS™ Table
The columns across the top of the table are divided into five functional categories. How to manage time, tasks, data, people, and productivity, These groups are numbered from one to five. Within each column, the rows start with the most elementary and simple concepts and grow in complexity as you move down the table. This is similar to the way bigger and heavier elements are found lower down on the periodic table of elements.
TIPTOPS™ comprises the following groups:
Group 1: Time management
Group 2: Task management
Group 3: Data management
Group 4: People management
Group 5: Productivity management
Using TIPTOPS™ to solve your time management or productivity challenge
You don’t need to figure this out by yourself. Why not join me in a 45-minute root cause analysis meeting and I’ll help you identify the root cause of your time management issues? I use the Pareto principle to identify the small handful of things that are causing the majority of your problems. This will enable you to do some targeted just-in-time training, close the gap, and boost your productivity.
Let’s have a discovery call to see whether it’s worth spending 45 minutes together to do the root cause analysis.

“TIPTOPS™ enables you to get back to basics, understand the principles and work on the core skills that may be missing from your productivity portfolio” – Brett Dawson


